Define MACD – What is the MACD
To Define MACD – you have to look at the different components involved in the momentum indicator. First what does MACD stand for?
Answer: Moving Average Convergance Divergence
The MACD is a momentum indicator found in almost all (if not all) charting platforms. It will show up in the area below the chart. The indicator shows the relation between the 2 moving averages. And it has characteristics that include following the trend. The indicators as with all indicators lag the price and they are converted into a momentum oscillator that goes up and down above and below a zero line. There are not any limits on how high it can go or how low it can go.
The actual definition of MACD is the difference between the fast moving average and the slow moving average.
Generally the standard settings or inputs of the MACD are
12, 26, 9. 12 = Fast Length or MACD, 26 = Slow Length or the MACD Average and 9 = MACD Length.
Fast Length is the amount of bars that are used to calculate the the fast moving avg
Slow Length is the amount of bars that are used to calculate the slow moving avg
MACD Length is the amount of bars that are used to calculate the moving avg of the MACD
How it is Plotted on the chart
Value = the value of the MACD
Average = the moving average of the MACD
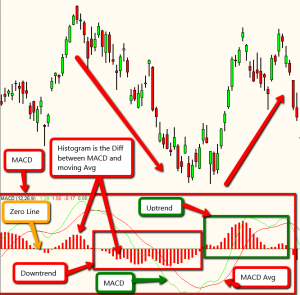
Difference = The difference between the MACD and its moving average and its generally displayed as a histogram
Zero Line = the middle of the indicator that the histogram goes above and below
See chart below for further understanding of how to define MACD.
Notice that the trend changes at a similar time to the MACD changes – obviously you have to use this in conjunction with some other type of strategy. You would have to build rules around how it used best in your trading plan.

