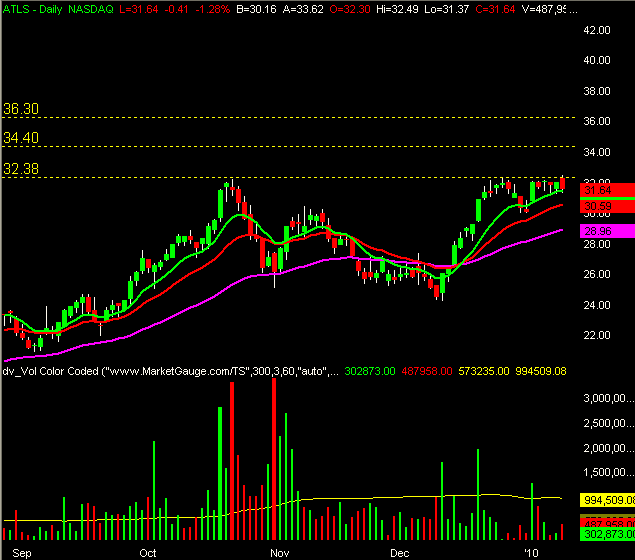
Daily Indicators:
Moving Averages (used for Trend)
- Moving Avg Exponentials
- 10 (Green Dashes)
- 18 (Red Dashes)
- 20 (Magenta Dashes)
- Daily 14 ATR
IntraDay Indicators:
- Openning Range High and Low
- 5 Min OR High and Low
- 30 Min OR High and Low
- Simple Moving Averages
- 4 (Green)
- 9 (Red)
- 18 (Magenta)
- Mov Avg Exponential–I only use this on the 5 Minute Charts
- 60 (Dark magenta)
- Volume
Chart Time Frames
- I use the 60 min and the daily chart to find the opportunities and targets
- I use the 5 min for Entries and Exits
General Rules
- Do your homework the night or morning before–dont make trades on the fly
- Know your plan before making any trade
- Know where you want to enter
- Know where you want to exit if it goes against you (stops)
- Know where your targets are so you know when to take some off the table
- know your time frame–ie day trade, mini swing trade, swing trade,position trade
- What is the trend of the current market/the stock you want to trade
- Odds are with you if you are trading long on and up trending stock
- Odds are with you if you are trading short on a down trending stock
Stock Criteria
- Price: 20 and greater
- Volume: >500,000
- Moving Averages
- 10 EMA
- 20 EMA
- 50 EMA
- Moving Averages trending: 10EMA > 20EMA > 50EMA
Setups
- Setups are all trending stocks either up or down. I don’t have a preference—and this is determined by the 10EMA>20EMA>50EMA
- After I see that the stocks are trending I want to find a good entry point and my entry points are of two types:
- Break out from a consolidation
- Or a pull back to some sort of support whether it be the 10 EMA, 20EMA or 50EMA
- Once its hitting support I want confirmation of a trend line break before blindly entering
Entries
- After I have gone through the list of stocks meeting the criteria I will determine the best break out point / point of entry–the line I put on the charts is a general area–not a specific price
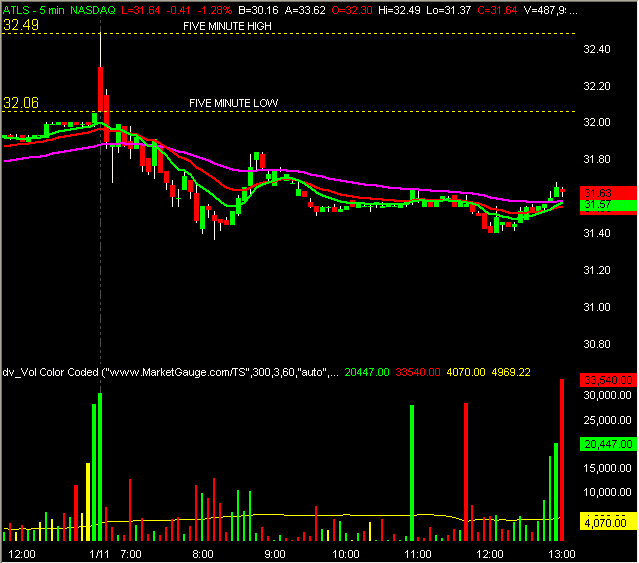
- I like to use the 5 min High and Low of the following days open to confirm the entry
- For example
- If current price is 24.99 and the entry point is 25.25 I will let the stock open the next morning and wait for the first 5 mins to finish
- Once the first 5 min candle has closed I want the stock to break above the 5 min High and above the entry of 25.25 in this example
- So if the stock opened and moved to 25.27 in the first 5 mins I would wait for the candle to close. Once the candle closes the new entry would be above 25.27 plus a few cents. This technique helps avoid the opening head fake as seen below
- ATLS gapped open and moved above the entry price up to 32.49 which was the 5 min high (which also was the high of the day) and then reversed down to the 5 min low of 32.06
- So based on this criteria the entry point on this day would have changed from 32.38 to 32.49 plus a few cents (32.53)—and I would have not entered this as of yet
- For example
5 Min
Stops
- In short its Prior Days Low if Long and Prior Days High
- I like to give it a little wiggle room though so I would look at the prior days low then find the next Floor trader pivot below it and put my stop below that line
- Other times if maybe the stocks prior day high or low is far away I will look for other support areas to reduce the risk/reward


