[et_pb_section bb_built=”1″][et_pb_row][et_pb_column type=”4_4″][et_pb_text admin_label=”Intro” _builder_version=”3.0.62″ background_layout=”light” text_orientation=”left” text_font_size=”18″ border_style=”solid”]
ADX/DMI Details Below Are From:
- A webinar presentation from The Trading Zone / Chart Trading Patterns.
- These details present a Simple Trading System Using ADX and DMI Indicators
[/et_pb_text][et_pb_button _builder_version=”3.0.62″ button_text=”Download Detailed PDF Version of ADX/DMI Simple Trading Plan” button_url=”https://tradingthesetup.com/simple-adx-dmi-trading-system-opt/” url_new_window=”off” button_alignment=”center” background_layout=”light” custom_button=”on” button_text_color=”#ffffff” button_bg_color=”#e09900″ button_letter_spacing=”0″ button_icon_placement=”right” button_letter_spacing_hover=”0″ button_border_radius=”9″ button_text_size=”18″ /][et_pb_text admin_label=”Chart 1″ _builder_version=”3.0.62″ background_layout=”light” text_orientation=”left” border_style=”solid” custom_margin=”||0px|” custom_padding=”||0px|” text_font_size=”18″]
Chart
- Range, Tick, Volume or Renko chart – all will work for this
- This example 4 Range which means every candle has height of 4 ticks
- Tradestation
- Range = .04
- Using 1 Tick Interval
- Ninjatrader
[/et_pb_text][et_pb_button _builder_version=”3.0.62″ button_text=”For More Info Check out the Free Video Here and Get 50% off ChartPatternTrading.com ADX Trading course” button_url=”http://tradingthesetup.com/cpt-adx-discount” url_new_window=”off” button_alignment=”center” background_layout=”light” custom_button=”on” button_border_color=”#e02b20″ button_letter_spacing=”0″ button_icon_placement=”right” button_letter_spacing_hover=”0″ button_text_color=”#e02b20″ button_border_width=”4″ button_border_radius=”5″ button_font=”|on|||” button_text_size=”18″ /][et_pb_text admin_label=”Chart Continued” _builder_version=”3.0.62″ background_layout=”light” text_orientation=”left” border_style=”solid” custom_margin=”0px|||” text_font_size=”18″]
- To get more signals decrease the range value
- To get less signals increase the range value
- Dont use a minute chart
- ADX – Default (14 period)Change from Line Chart to Histogram to differentiate between the indicators when quickly looking
- 3 Horizontal lines on ADX chart
- DMI (DI+, DI-) (Default 14 period)
- Dont use the indicator that has DMI, and ADX together – add them separately
- DI+ Green Line
- DI- Red Line
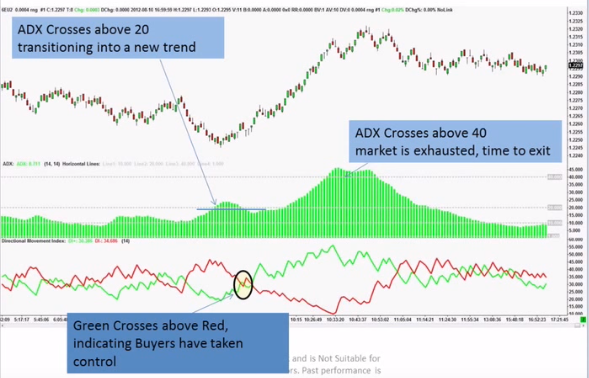
How to use the ADX, Di+ and Di-
- Step 1: Start with the strength of the Trend. If there is no trend don’t trade
How to Measure Trend?
-
- Step 1 Use ADX to Determine Trend
- 0 -10 – No Trend – No trade
- 10 -20 – Transition
- 20 -40 – Trending
- 40+ – Exhaustion
- Step 2 Use Di- and Di+
- Sellers are in charge or if Di- is above Di+
- Buyers are in charge if Di+ is above Di-
- Step 3: Combine the ADX (Trend strength with the Di+ and Di- Direction
Putting it all together
- Look at chart ADX – you see it moving up to 20 area
- Now look for Di+ crossing over the Di- line
- That is your buy indicator
- Now watch ADX – Look to exit when it crosses above 40
[/et_pb_text][et_pb_button _builder_version=”3.0.62″ button_text=”Download Detailed PDF Version of ADX/DMI Simple Trading Plan” button_url=”http://tradingthesetup.com/adx-article-download” url_new_window=”off” button_alignment=”center” background_layout=”light” custom_button=”on” button_text_color=”#ffffff” button_bg_color=”#e09900″ button_letter_spacing=”0″ button_icon_placement=”right” button_letter_spacing_hover=”0″ button_border_radius=”9″ button_text_size=”18″ /][et_pb_text admin_label=”Disclaimer” _builder_version=”3.0.62″ background_layout=”light” text_orientation=”left” border_style=”solid” text_font_size=”18″]
- ***Trading involves and is not suitable for everyone. Past performance is never indicative of future results. Trade at your own Risk**
[/et_pb_text][/et_pb_column][/et_pb_row][/et_pb_section]